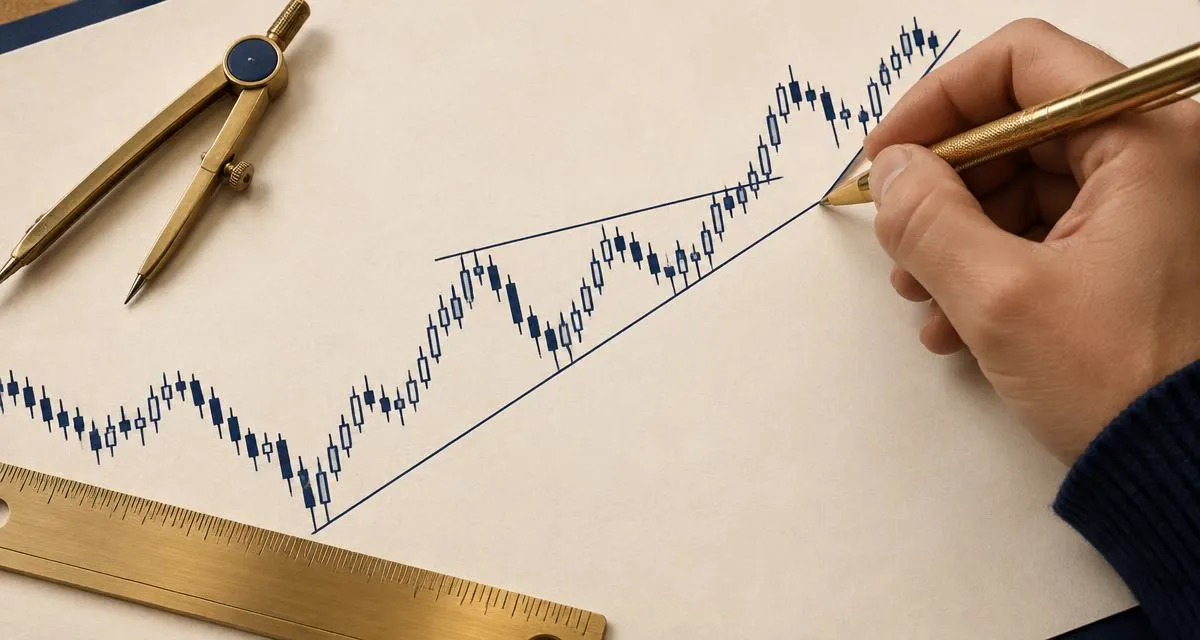
The core idea
Technical analysts start from a practical premise: price already reflects the information and emotions of market participants, and patterns of behaviour tend to repeat. Whether you agree fully or not, charts are the shared language of most trading platforms, so learning to read them is essential.
Reading a candlestick
Each candlestick summarises one period — one minute, one hour, one day. It shows four prices: open, high, low and close.
- Body: the range between open and close.
- Wicks: the highest and lowest prices reached.
- Green / bullish: closed above its open.
- Red / bearish: closed below its open.
Long wicks show rejection: price went somewhere and was pushed back. Small bodies suggest indecision. Single candles carry little weight on their own; context matters more.
Trends and market structure
An uptrend is a sequence of higher highs and higher lows. A downtrend is lower highs and lower lows. When neither pattern holds, the market is ranging. Identifying which state you are in is the most valuable first step in any chart reading.
Trendlines
A trendline connects successive lows in an uptrend or highs in a downtrend. The more times price respects a line, the more traders notice it — which can make reactions there self-reinforcing until they are not.
Support and resistance
Support is a zone where buying has previously halted declines; resistance is a zone where selling has halted advances. Treat them as areas, not exact prices. When a level breaks decisively, old resistance often becomes new support and vice versa.
Indicators: tools, not signals
| Indicator | What it measures | Common use | Limitation |
|---|---|---|---|
| Moving average (SMA/EMA) | Average price over N periods | Trend direction, dynamic support | Lags price |
| RSI | Speed of recent gains vs losses (0–100) | Momentum, overbought/oversold | Can stay extreme in strong trends |
| MACD | Relationship of two EMAs | Momentum shifts | Late in fast markets |
| Bollinger Bands | Volatility around an average | Squeeze and expansion | Not directional alone |
| Volume | Activity behind a move | Confirmation | Less reliable in decentralised FX |
Indicators are mathematical transformations of price. Stacking many of them rarely adds information and often adds confusion. Two or three, understood well, are usually enough for learning.
Timeframes
The same market can be in an uptrend on the daily chart and a downtrend on the hourly chart. Many traders use a higher timeframe for direction and a lower one for timing. Shorter timeframes produce more signals — and more noise and costs.
Limits of technical analysis
- Patterns are clearer in hindsight than in real time.
- Unexpected news can override any chart setup instantly.
- Confirmation bias makes it easy to see what you hope to see.
- Costs and slippage can turn a good-looking backtest into a losing method.
Charting tools on trading platforms
Charting packages differ across providers in timeframes, drawing tools, indicator libraries and data quality. Some traders explore platforms such as PFW Management when comparing different trading environments, and charting is one practical area to compare. Our detailed analysis of PFW Management includes usability among its evaluation lenses, and how trading platforms work explains where price data comes from.
Next, apply these concepts in trading strategies for beginners.
Educational disclaimer: This article is for general education only and is not financial, investment or trading advice. Trading involves risk, including the loss of capital. This site is not affiliated with PFW Management.
Written & reviewed by
Financial Markets Research Team
Our team studies public information, platform documentation and market data to produce independent, education-first analysis. Read our editorial policy and research methodology. Last updated 2026-11-12.